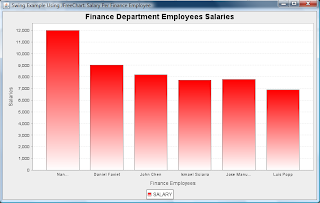
Our third example in the article covered how to use JFreeChart in a Swing-based application and rendered a bar chart for the example. In this blog, I show how easy it is to modify that example to use gradients.
The basic Swing class used to display the JFreeChart-generated bar chart is shown here:
package org.marx.hr.charting;

import java.awt.image.BufferedImage;

import javax.swing.ImageIcon;
import javax.swing.JFrame;
import javax.swing.JLabel;

import org.jfree.chart.JFreeChart;
import org.jfree.chart.plot.PlotOrientation;

/**
 * Class that produces simple Swing application to render a JFreeChart-generated bar chart.
 */
public class HrChartingSwingRenderer
{
   /**
    * Create the GUI and show it.  For thread safety,
    * this method should be invoked from the
    * event-dispatching thread.
    */
   private static void createSimpleDemonstrativeLabel(
      final String aTitle)
   {
      HrChartCreator chartCreator = new HrChartCreator();
      JFrame frame = new JFrame(aTitle);
      frame.setDefaultCloseOperation(JFrame.EXIT_ON_CLOSE);

      JFreeChart barChart =
         chartCreator.createSalaryPerFinanceEmployeeBarChart(
            PlotOrientation.VERTICAL );

      BufferedImage image =
         barChart.createBufferedImage(750,450);
      JLabel label = new JLabel();
      label.setIcon(new ImageIcon(image));
      frame.getContentPane().add(label);

      frame.pack();
      frame.setVisible(true);
   }

   public static void main(String[] args)
   {
      javax.swing.SwingUtilities.invokeLater(new Runnable()
      {
         public void run()
         {
            createSimpleDemonstrativeLabel(
                 "Swing Example Using JFreeChart: "
               + "Salary Per Finance Employee");
         }
      });
   }
}
As shown in this Swing-based class, the
HrChartCreator class is used for generating the bar chart. Specifically, the createSalaryPerFinanceEmployeeBarChart method is called on that class. The code listing for that method as used in the article example is shown next:
   /**
    * Create Bar Chart showing salary of each employee.
    *
    * @param aOrientation Horizontal or Vertical
    *        orientation of bar chart.
    * @return Bar Chart.
    */
   public JFreeChart createSalaryPerFinanceEmployeeBarChart(
      final PlotOrientation aOrientation)
   {
      JFreeChart barChart = null;
      public static final String QUERY_SALARY_PER_FINANCE_EMPLOYEE =
         "SELECT first_name || ' ' || last_name AS Name, salary " +
           "FROM employees " +
          "WHERE department_id = 100";

      try
      {
         final CategoryDataset barDataset =
            new JDBCCategoryDataset(
               databaseAccess.getOracleDbConnection(),
               QUERY_SALARY_PER_FINANCE_EMPLOYEE );

         barChart =
            ChartFactory.createBarChart(
               "Finance Department Employees Salaries", // chart title
               "Finance Employees",
               "Salaries",
               barDataset,
               aOrientation,
               true,      // legend displayed
               true,      // tooltips displayed
               false );   // no URLs

      }
      catch (SQLException sqlEx)
      {
         System.err.println(
            "Error trying to acquire JDBCCategoryDataset.");
         System.err.println(
            "Error Code: " + sqlEx.getErrorCode());
         System.err.println(  "SQLSTATE:   "
                            + sqlEx.getSQLState());
         sqlEx.printStackTrace();
      }

      return barChart;
   }
In the example in the article, Figure 7 shows a snapshot of the Swing application with the JFreeChart-generated bar chart. The bars in the bar chart use the default first color (red) for the bars and the bars are solid in color. A gradient could be used here to make the chart a little more interesting and possible even a little more aesthetically pleasing.
Only a few additional lines are needed to add gradients to the bars in this chart. Had we been using a
CategoryPlot for other purposes anyway, even fewer individual lines would be needed because we would have already had access to the CategoryPlot and possibly to the BarRenderer. The code listing below shows the method with gradients added. The newly added lines for gradient support are highlighted.
   /**
    * Create Bar Chart showing salary of each employee.
    *
    * @param aOrientation Horizontal or Vertical
    *        orientation of bar chart.
    * @return Bar Chart.
    */
   public JFreeChart createSalaryPerFinanceEmployeeBarChart(
      final PlotOrientation aOrientation)
   {
      JFreeChart barChart = null;
      public static final String QUERY_SALARY_PER_FINANCE_EMPLOYEE =
         "SELECT first_name || ' ' || last_name AS Name, salary " +
           "FROM employees " +
          "WHERE department_id = 100";

      try
      {
         final CategoryDataset barDataset =
            new JDBCCategoryDataset(
               databaseAccess.getOracleDbConnection(),
               QUERY_SALARY_PER_FINANCE_EMPLOYEE );

         barChart =
            ChartFactory.createBarChart(
               "Finance Department Employees Salaries, // chart title
               "Finance Employees",
               “Salaries”,
               barDataset,
               aOrientation,
               true,      // legend displayed
               true,      // tooltips displayed
               false );   // no URLs

         final CategoryPlot plot = barChart.getCategoryPlot();
         final BarRenderer renderer = (BarRenderer) plot.getRenderer();
         final GradientPaint gradient =
            new GradientPaint( 0.0f, 0.0f, Color.RED.brighter(),
                               0.0f, 0.0f, Color.WHITE );
         renderer.setSeriesPaint(0, gradient);
      }
      catch (SQLException sqlEx)
      {
         System.err.println(
            "Error trying to acquire JDBCCategoryDataset.");
         System.err.println(  "Error Code: "
                            + sqlEx.getErrorCode());
         System.err.println(  "SQLSTATE:   "
                            + sqlEx.getSQLState());
         sqlEx.printStackTrace();
      }

      return barChart;
   }
The new version of the bar chart with gradients is shown next (click on image to see larger version):

With just a few extra lines of code we were able to easily enhance our bar chart to use a gradient rather than solid color for its bars.
No comments:
Post a Comment